Mountains rise. Plates wander. Water finds a way downhill. Explore the records behind a generated planet, from ocean floors to the rocks beneath your feet.
Compare elevation with rainfall, trace a drainage basin, or follow the plates back through saved time. Feature positions come from the recorded world, not hand-picked landmarks.
Eleven present-day maps, plus boundary class, sediment, erosion and crust-thickness history. Ten saved frames span 40 to 400 million model years. Playback crossfades pictures; it does not reconstruct motion between records.
The geology behind the colours
Every layer has a cause.
These are views of one engine’s saved planet products. The atlas explains those records; it does not run a second world simulation.
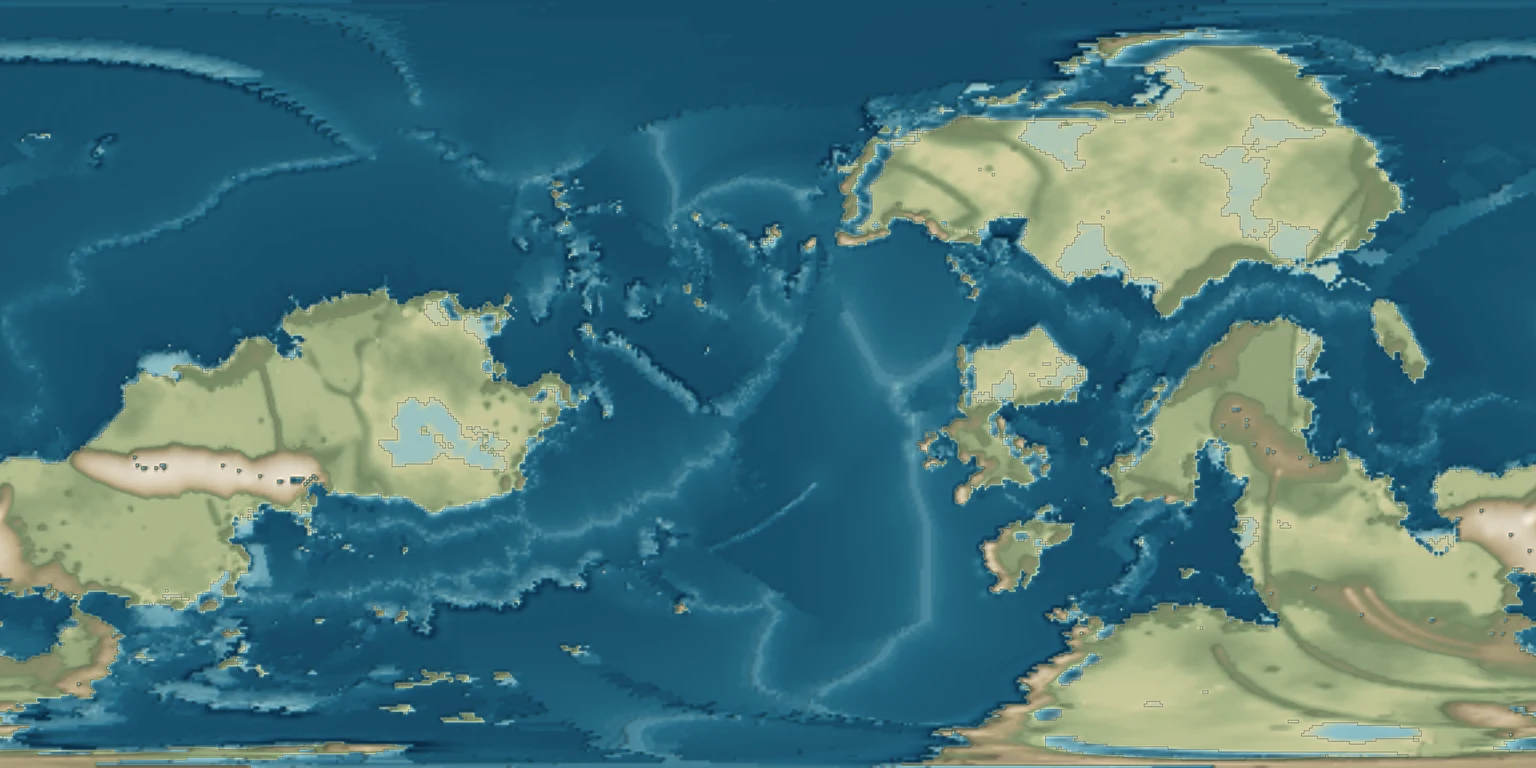
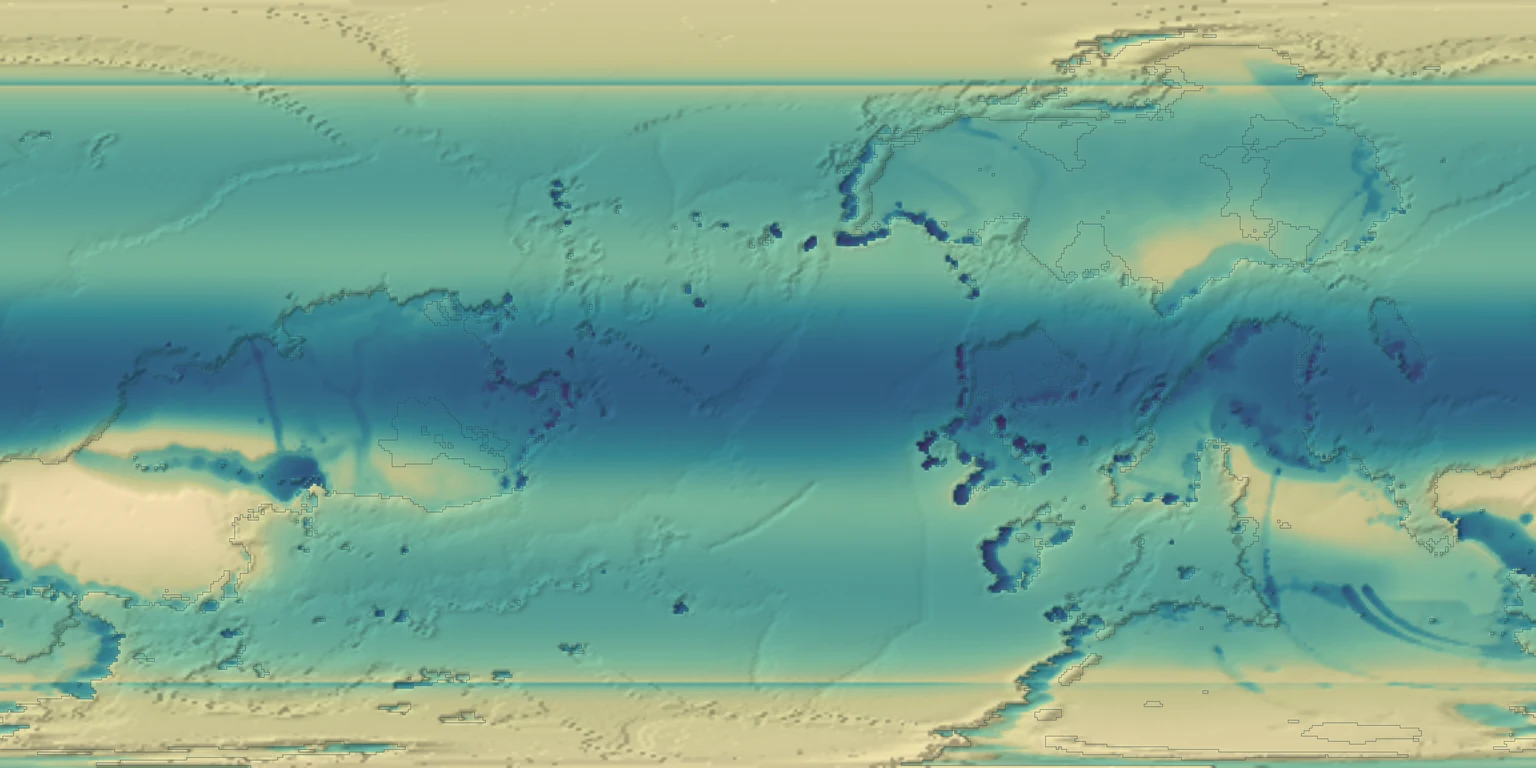
Topography & bathymetry
The surface balances uplift, the buoyancy of crust, and erosion. Colours show height above or below sea level. Shading makes the relief easier to read; it does not change the elevations.
How it started · where it is going
How it started
The planet starts with declared crust and a pattern of moving plates. As the simulation advances, stretching, collision and erosion reshape that starting surface.
Where it is going
Finer terrain will connect the planetary picture to the ground around a traveller. More detail must follow the same geology and drainage.
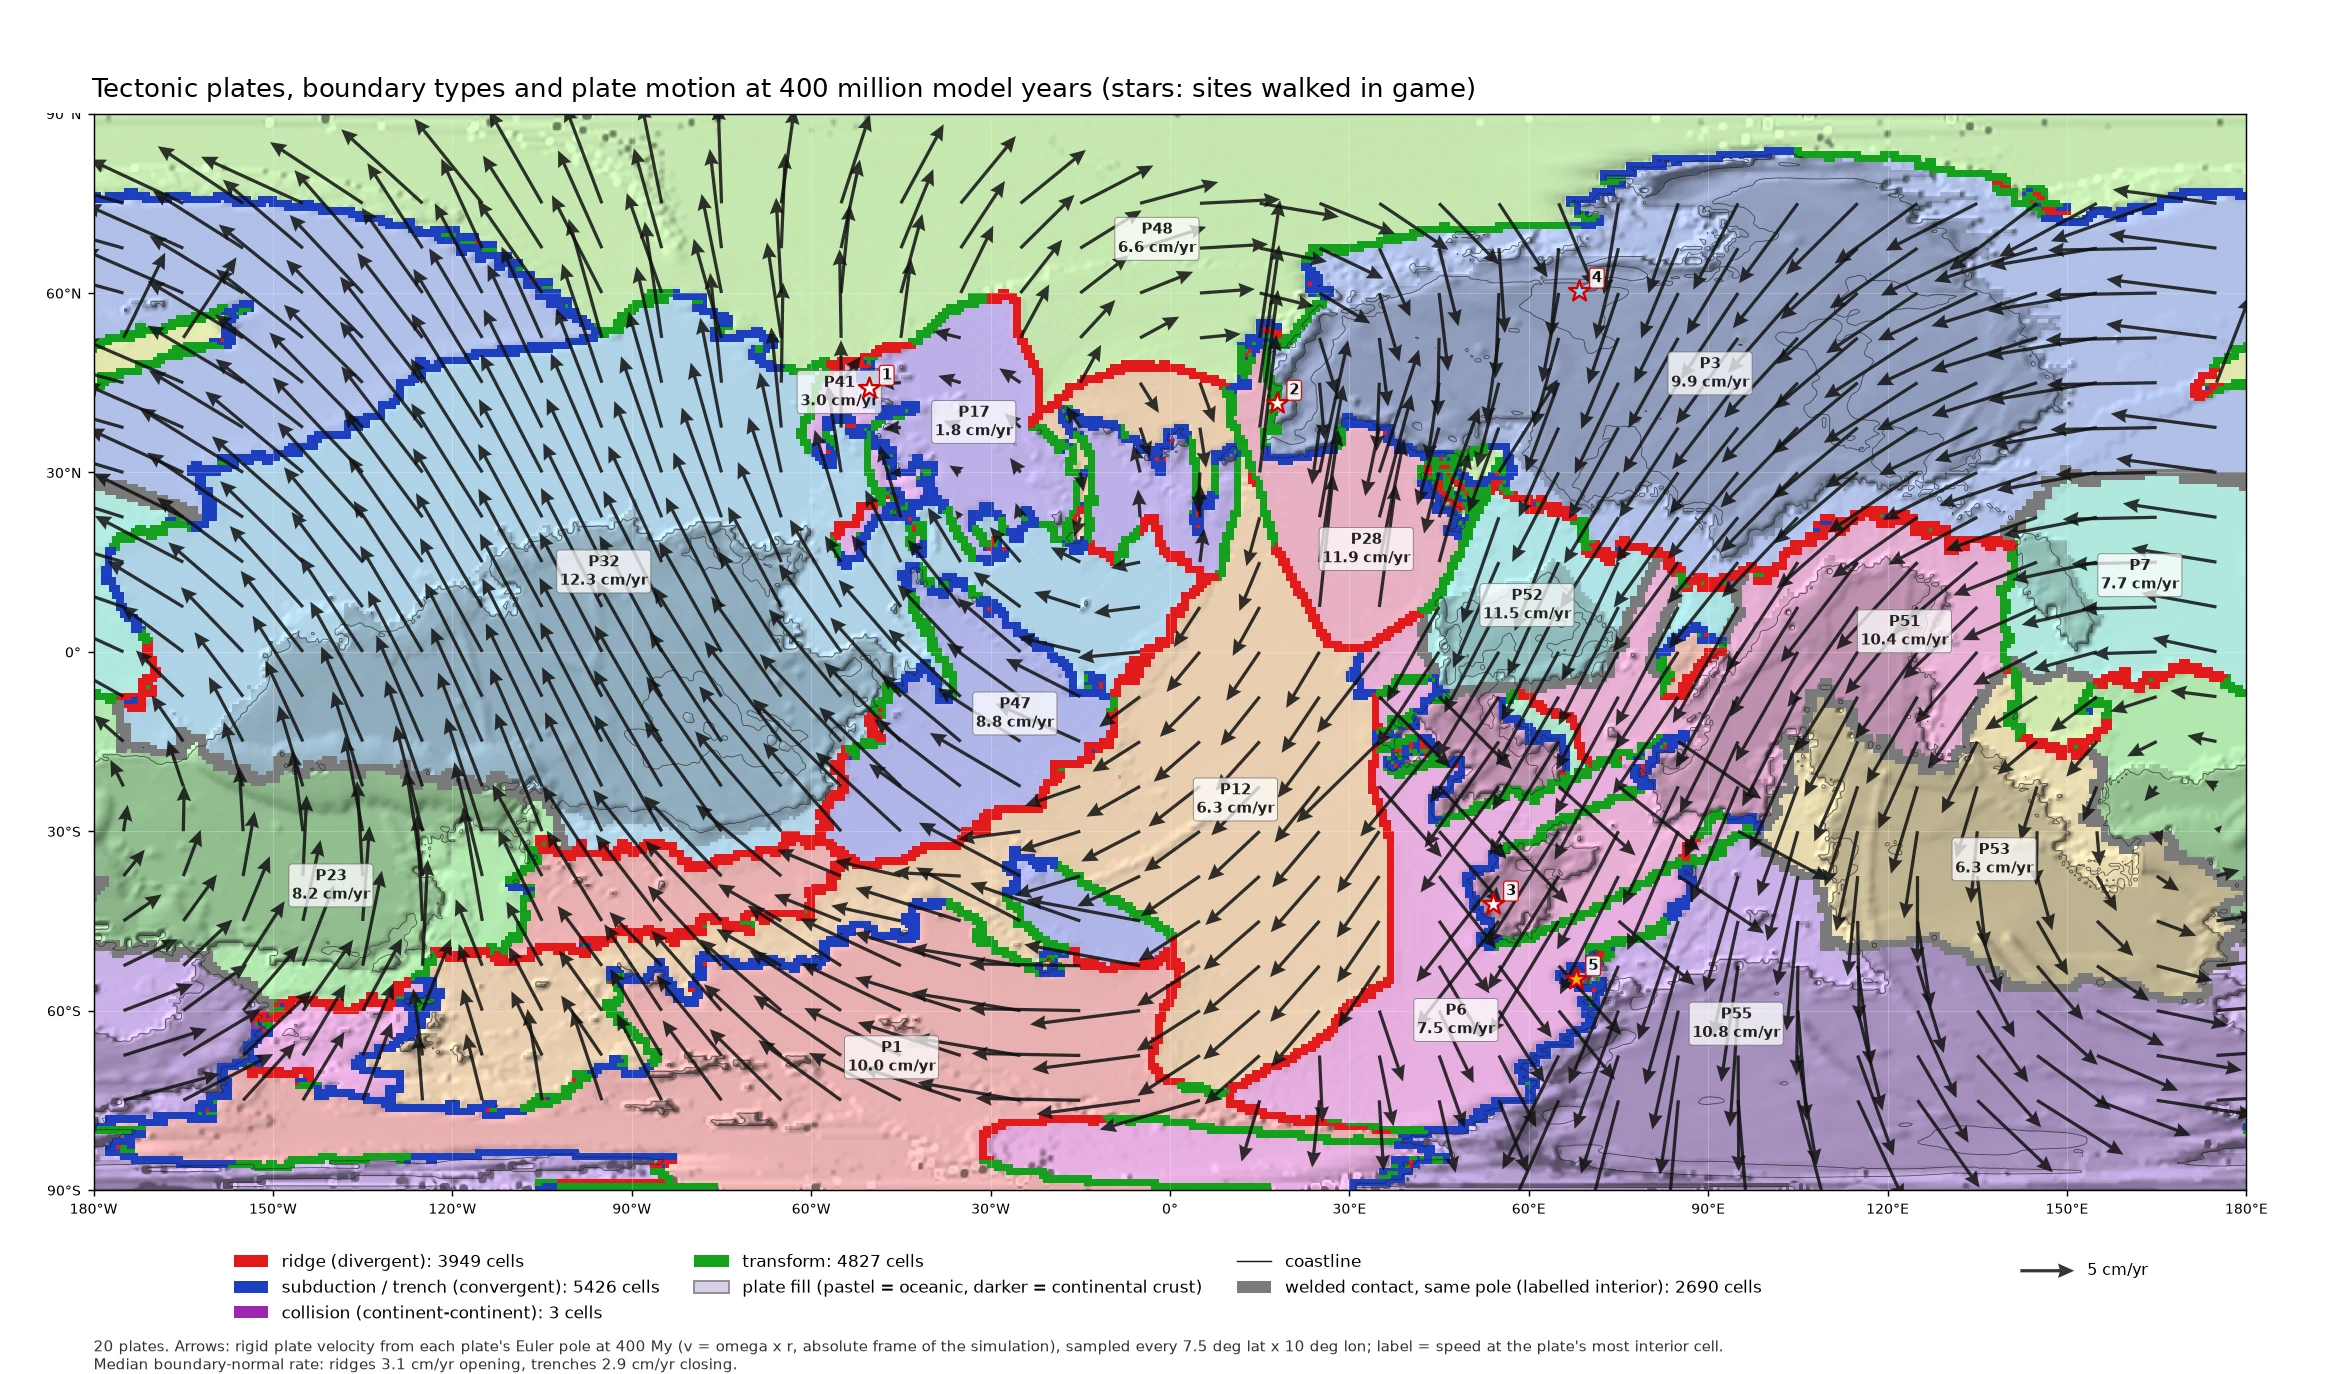
Plates carry parcels of crust across a sphere. Their relative motion identifies spreading ridges, subduction, collision and sideways slip. Motion is prescribed by this model rather than solved from a full mantle flow.
How it started · where it is going
How it started
A starting arrangement of plates and crust provides the initial conditions. Saved frames record how the arrangement changes over four hundred million model years.
Where it is going
More frequent saved frames will make the history easier to follow. Stronger links between motion, crust formation and rock history will make the consequences more complete.
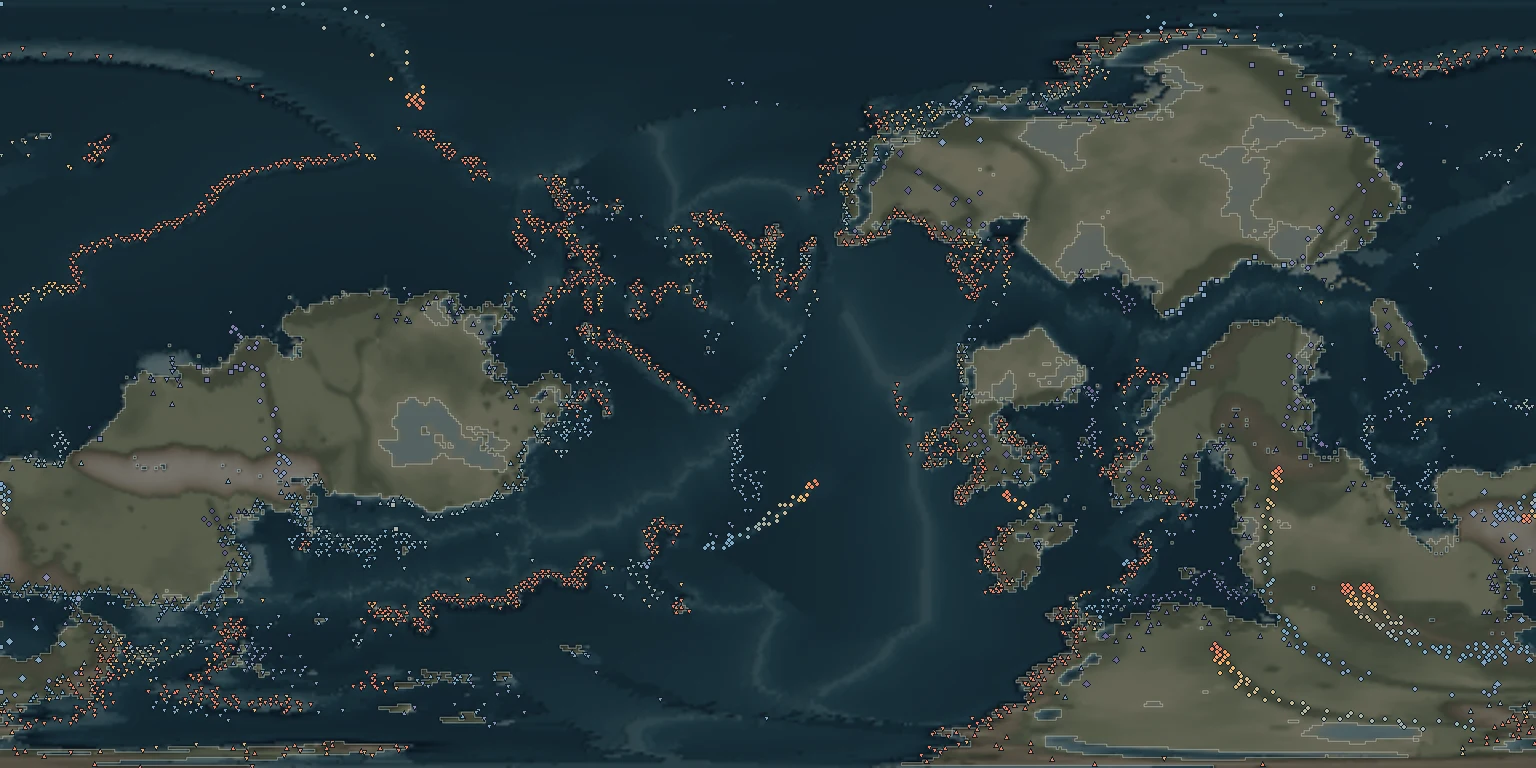
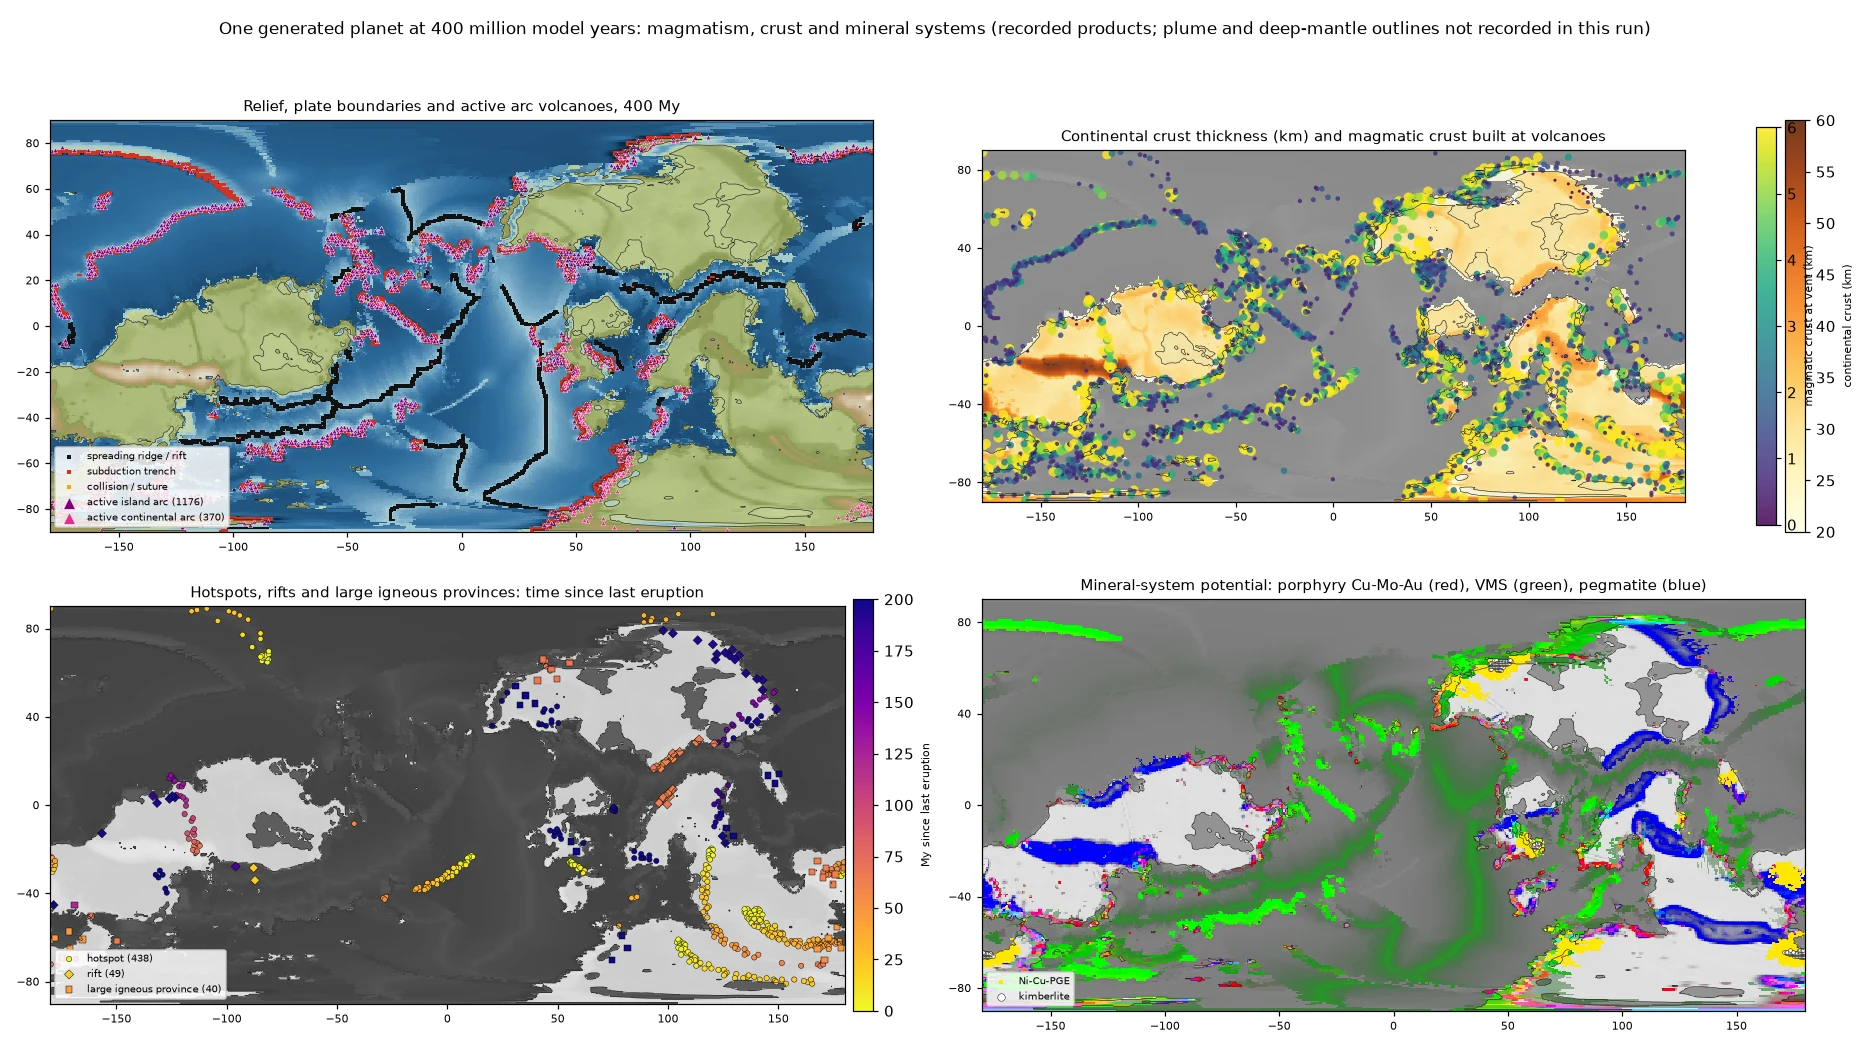
The records distinguish volcanic arcs, hotspots, rifts and broad volcanic provinces. Symbols mark recorded vents, including submerged ones. Their size is a map convention, not the width of a volcano.
How it started · where it is going
How it started
Volcanism begins in the settings supplied by plate motion and the model’s melt rules. The records retain onset and last-eruption times; a quiet vent still has a history.
Where it is going
Richer magma and eruption histories can connect material composition, landform shape and mineral formation. The map alone does not establish those missing chemical details.
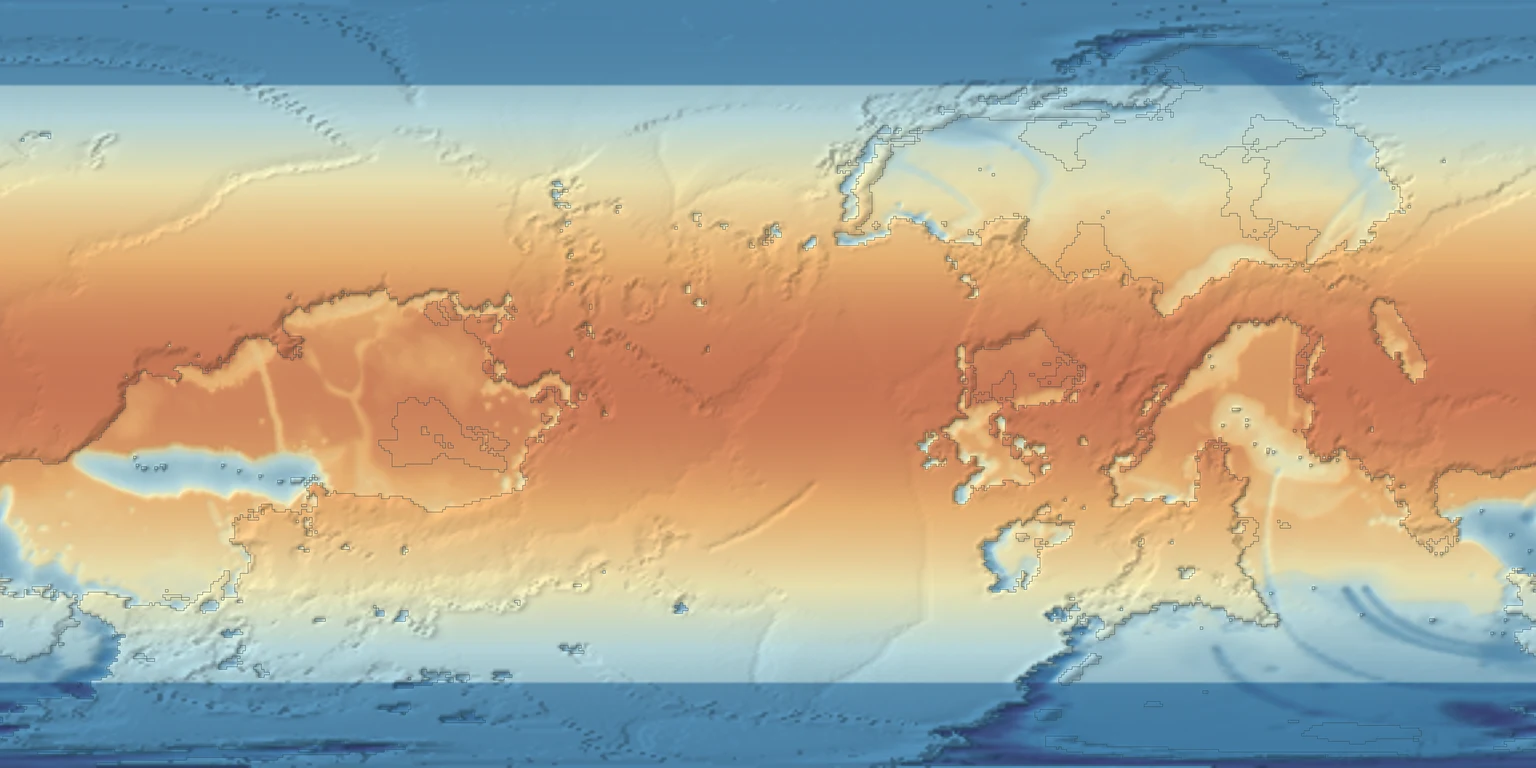
An energy-balance model combines sunlight, heat loss and transport toward the poles. Altitude cools the surface. This layer shows annual mean temperature calculated on the saved terrain, not daily weather.
How it started · where it is going
How it started
The climate calculation starts from the planet’s latitude, elevation and land–ocean pattern. It was calculated after this geological run, so it does not recover the climate in which old rocks formed.
Where it is going
Seasonal and formation-time climate records will help explain weathering, sediment and vegetation through time.
Moisture moves through the atmosphere, gains water from evaporation, and loses it as rain. Rising air over mountains encourages rainout. The colour scale is logarithmic so dry and wet regions can both be read.
How it started · where it is going
How it started
The saved climate calculation uses the terrain and ocean pattern. The older erosion calculation used uniform runoff, so these rainfall colours did not drive the rivers shown here.
Where it is going
Using the same rainfall history for erosion and deposition will connect these maps causally, rather than merely placing them side by side.
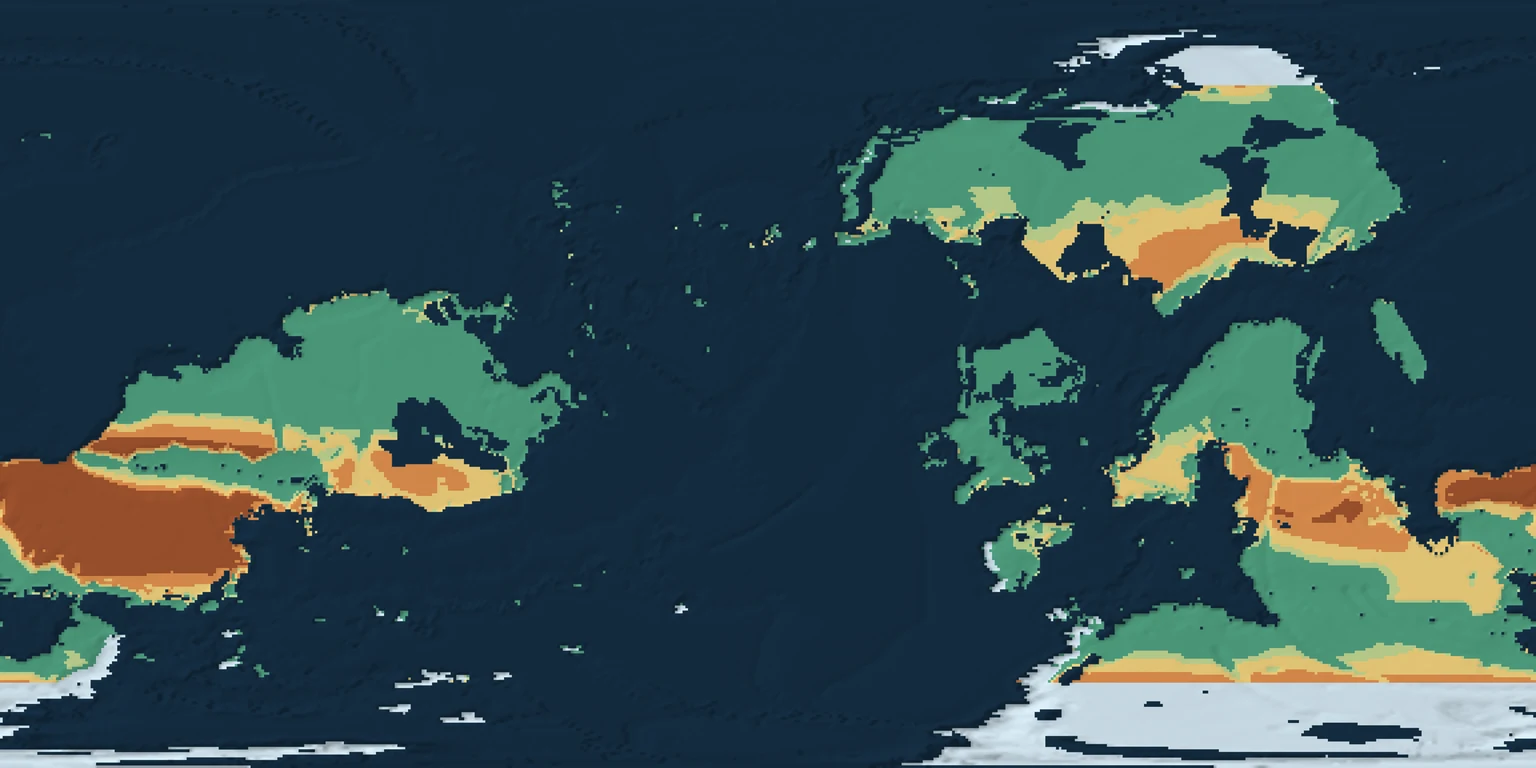
Dryness depends on both water supply and drying demand. The aridity index divides precipitation by potential evapotranspiration: how much water the atmosphere could remove. Small values indicate drylands.
How it started · where it is going
How it started
The index is derived from the saved annual climate. Where drying demand is zero, the ratio is undefined and is labelled separately; an icy region is not automatically a desert in this classification.
Where it is going
Seasonal water budgets and recorded past climates can improve the connection to soils, vegetation and climate-sensitive mineral formation.
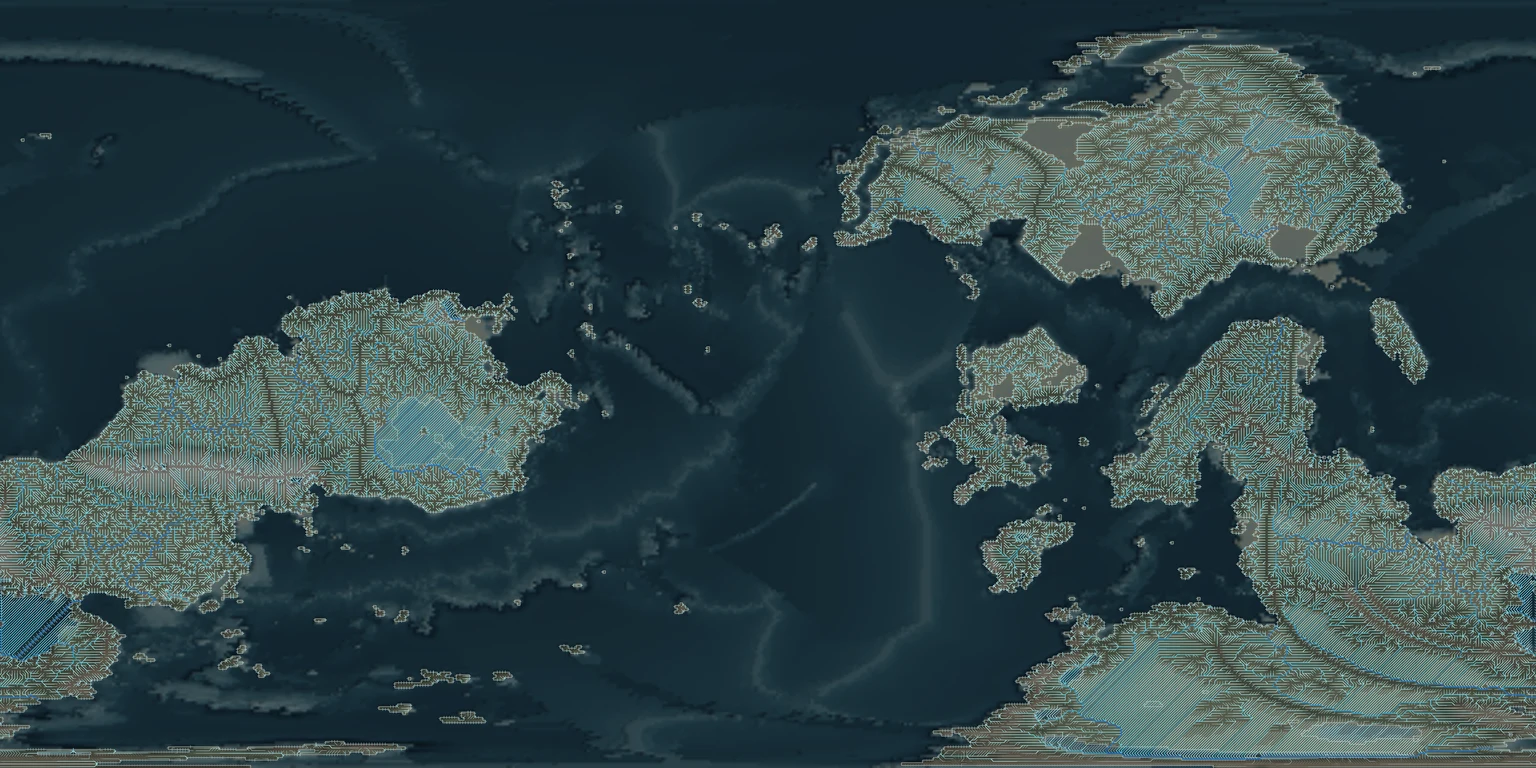
Each river segment follows a recorded downstream receiver. Water collects as paths join, and the line styling indicates a runoff-based discharge estimate. Rivers belong to the drainage network rather than a drawn guide line.
How it started · where it is going
How it started
This network was solved on a coarse grid with uniform runoff. Its regular patterns reflect cells about seventy kilometres across. It is not a fine-scale map of river bends.
Where it is going
Connected drainage at finer scales, flow-driven bank erosion, deposition and cutoff processes will bring the network closer to the rivers experienced on the ground.
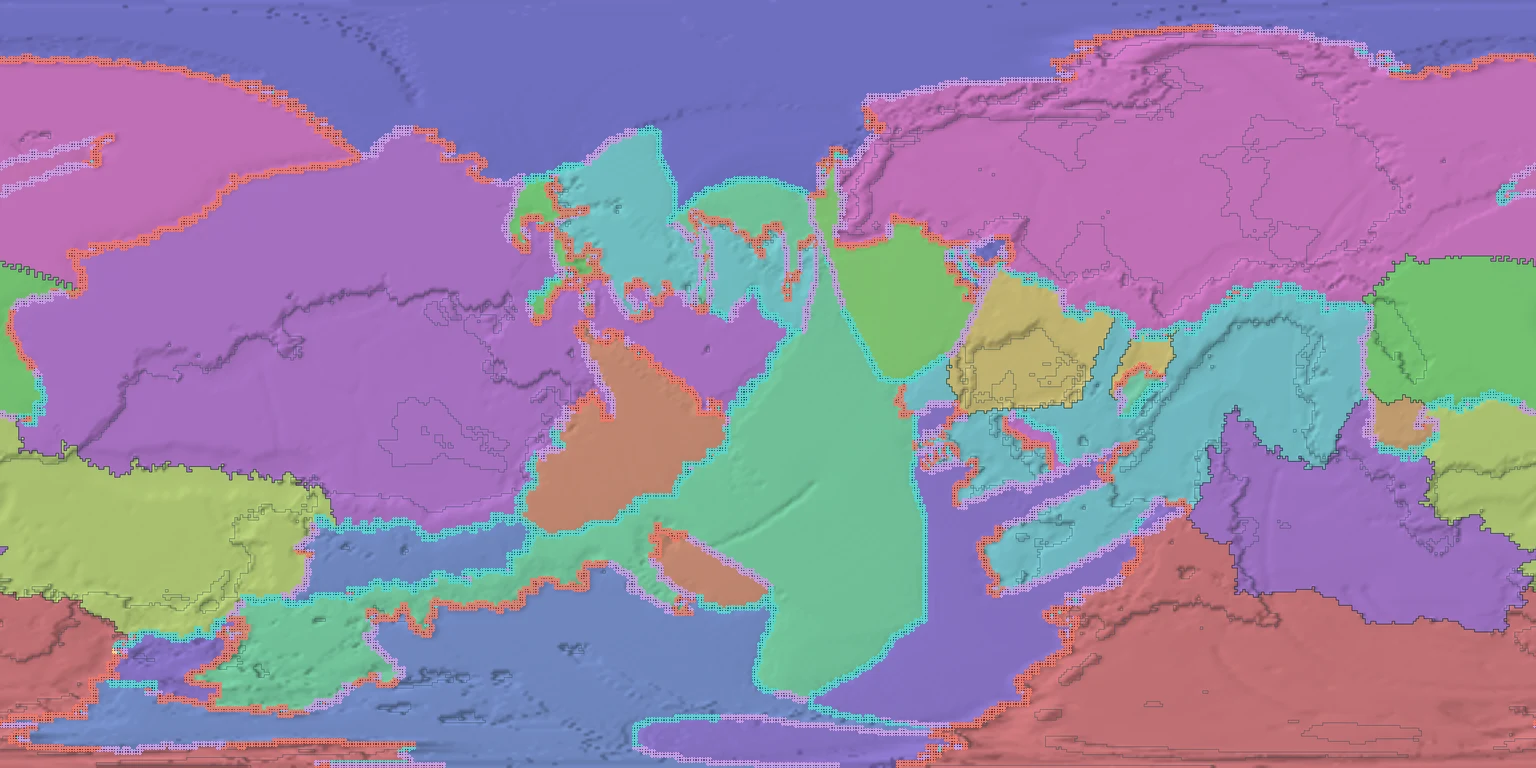
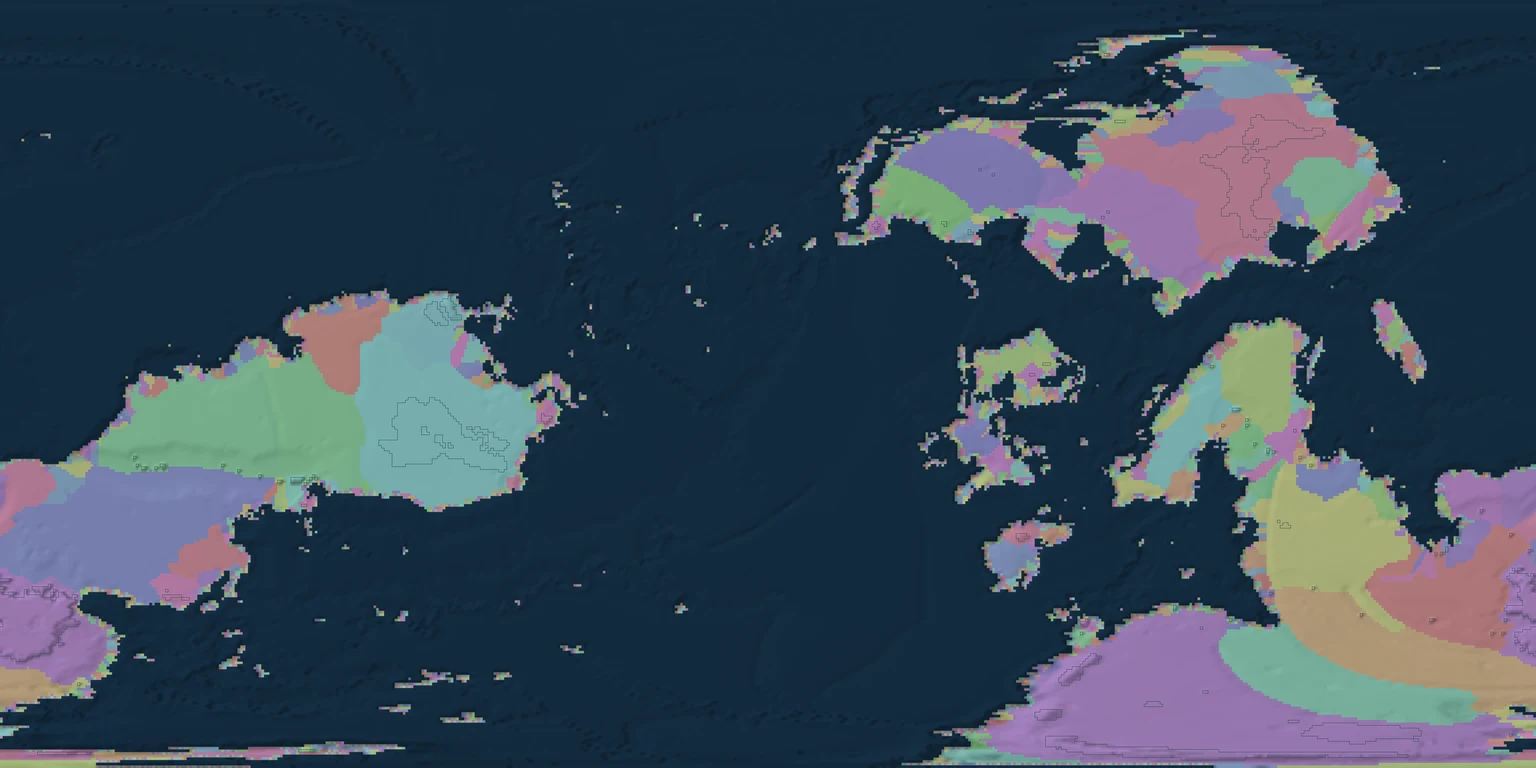
A basin collects water toward a shared outlet. Colours distinguish basin identities, not rainfall amounts. The labels use non-marine catchment area and the saved outlet records.
How it started · where it is going
How it started
Basins arise from the terrain and its downstream connections. The model records supported sea and lake terminals; a drainage path does not have to end in the sea.
Where it is going
Finer terrain must preserve connected flow, declared outlets and water balance. Changing a divide should be a modeled event with consequences downstream.
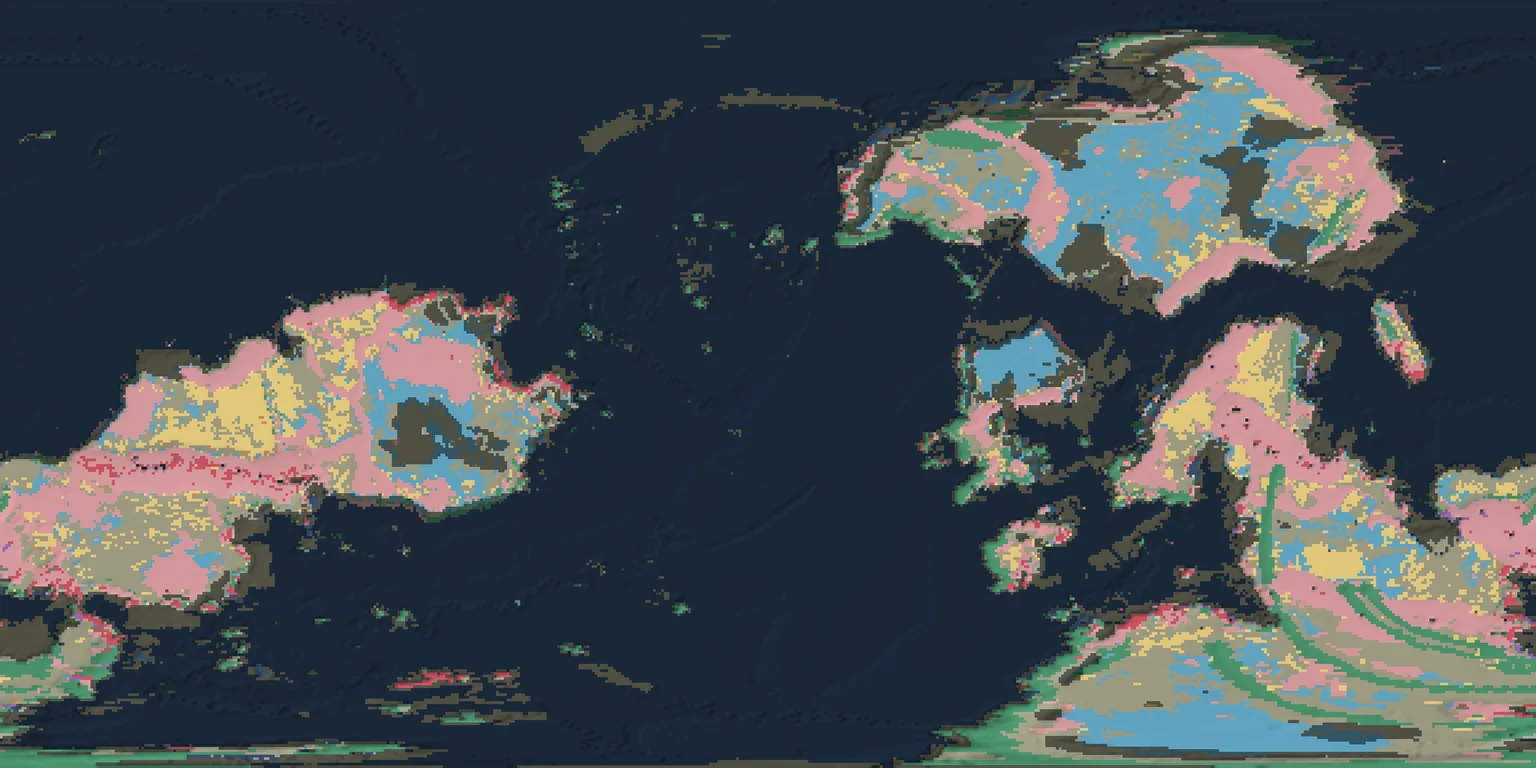
Lithology means rock type. Each cell shows the first recorded layer at least one metre thick. The result distinguishes broad volcanic, sedimentary and other rock classes; it is not a detailed survey of outcrops.
How it started · where it is going
How it started
Rock columns carry the effects of formation, deposition, burial and erosion. The map reads those columns at the saved present day, including declared material from before the simulated interval.
Where it is going
More complete formation and pressure–temperature histories will connect broad rock classes to detailed underground structure and fresh exposures.
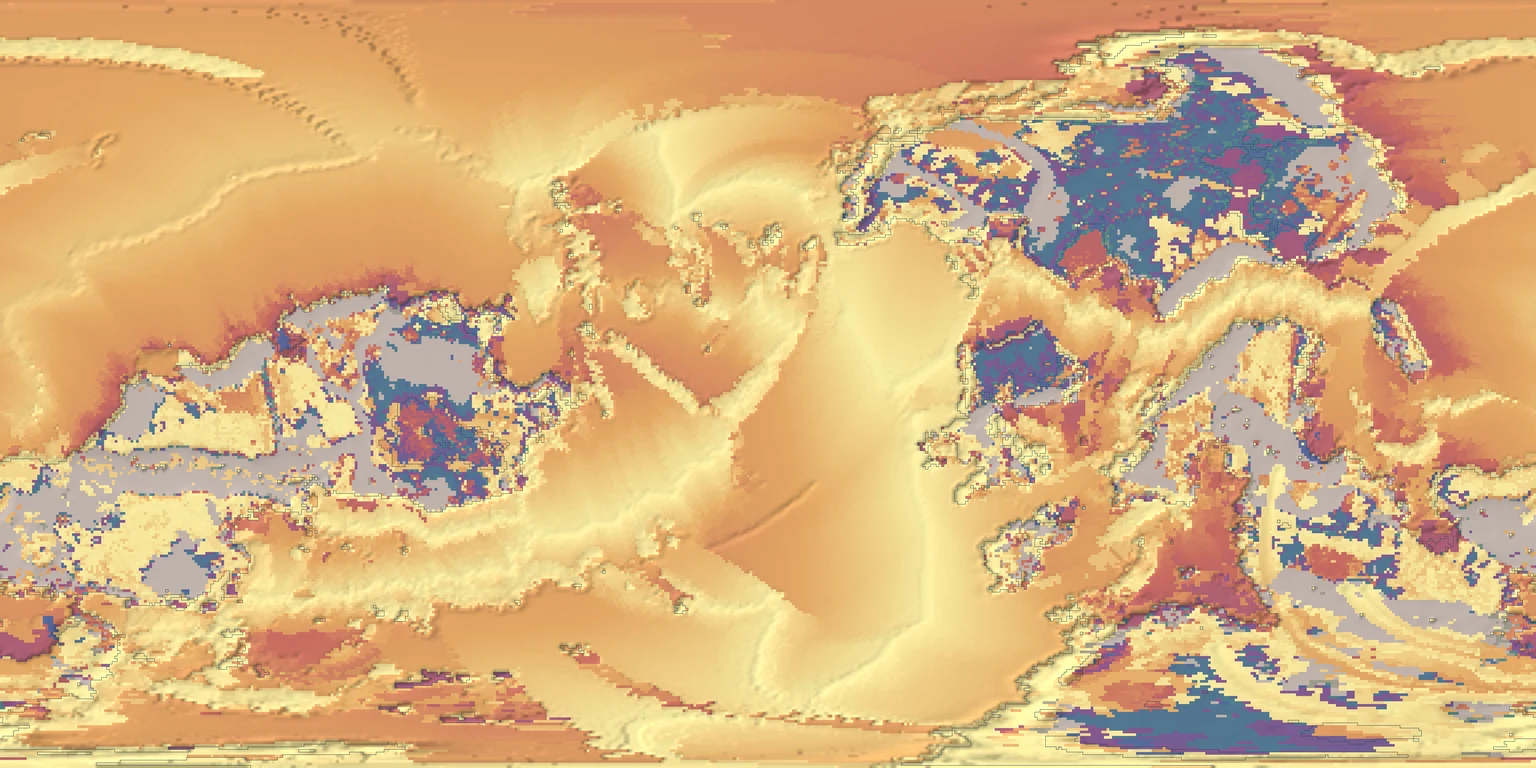
Surface rock age measures time before the final snapshot, using the midpoint of the exposed layer’s formation interval. An interval is an uncertainty range, not an exact birthday.
How it started · where it is going
How it started
Some starting crust is older than the four-hundred-million-year run. Those older ages are initial conditions; they are not evidence that all of that earlier history was simulated.
Where it is going
Keeping formation, burial and exposure histories distinct will make it possible to explain why old rock is exposed at a young landscape surface.
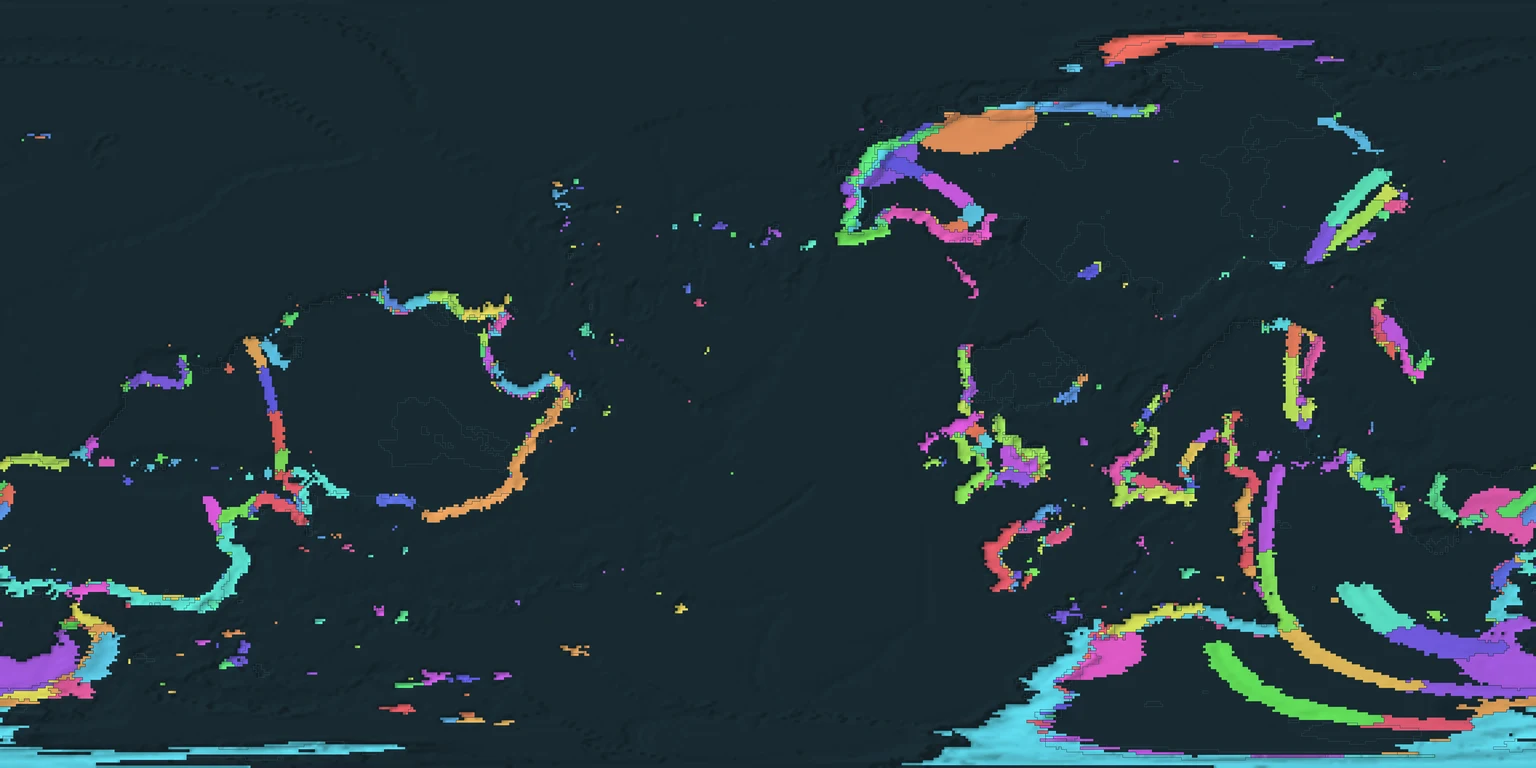
Mineral provinces group connected geological source support over twenty-million-year intervals. The colours show the latest recorded membership of each crust parcel at its present position. They do not show ore grade or a mining boundary.
How it started · where it is going
How it started
The map is derived from retained volcanic and material history. Older memberships can overlap. Conditional mineral initialization uses finite source material; it is not a complete simulation of mantle chemistry and circulating fluids.
Where it is going
Formation history, finite mineral transfers and mining should tell one consistent story. Better fluid and chemical histories will replace conditional assumptions where the model is incomplete.
The game builds nearby terrain as a traveller moves through one generated world. Local rock and terrain detail come from the same geological products as the planetary view. Places are reached through continuous travel.
How it started
A global record provides the context from which local surfaces and material histories can be derived.
Where it is going
Continuous refinement will connect the wide view to the ground beneath the player, with consistent geology across the journey.
Destruction and mining
The whole world is intended to be blastable, mineable and destructible. Every request derives the terrain and material it needs at that place. A missing material rule must be explained as missing data, never disguised as a geographic permission boundary.
How it works
Breaking rock changes its form and location. Mining transfers finite material into collected lots while retaining its origin. Independent review checks proposed changes, and geometry is published before the authoritative world accepts them. New floating-point transfers conserve material within a stated tolerance of about 0.01% per mineral.
How it started
The foundation is shared geological source material with stable identity and a record of accepted changes. A source body enters the accounting record once, when first needed.
Where it is going
Terrain, fresh cuts, rubble, inventory and readable mineral origins must work together in the game. This atlas presents the concept and geological context; it is not a playable mining demonstration or proof of complete planet coverage.
Lessons from building a simulated planet
Make the explanation as honest as the picture.
Building the planet
Resolution is a promise
A smooth image is not a finer simulation. State the native cell size (here about 70 km for the whole planet), distinguish display interpolation from modelled detail, and show what remains unresolved.
Coarse to fine, only where needed
The planet is solved on 576 × 288 cells over 400 million model years; regions at 32 m and the ground beside the player at 2 m are generated from the level above, on demand, the moment someone travels there. Choices are keyed to place, so the same spot always comes out the same.
Connected models need shared causes
Climate, rivers, sediments and resources should exchange consistent histories. Copper and gold here come from recorded subduction-arc history (79 arc provinces, about 66,000 finite reservoirs), not from a table of ore odds.
Every lump of rock has a history
Mine a rock in the game and its record names the body it came from, the layer, the event that formed it, the blast that broke it and the stroke that collected it, with every microgram of every mineral accounted for.
Keep assumptions visible
Declared starting conditions and reduced models make large simulations practical. Give them units, validity limits and a clear path to replacement. Plate motion here is a prescribed model, and the page says so.
Test the result people use
Check a real interaction and look at the resulting image. A 1 TJ blast in the game, then mining the rubble, then reading the inventory, catches problems that thousands of unit checks miss.
Using Unreal
Keep the truth outside the engine
The world record lives in a Rust server. Unreal can crash or be replaced and a blasted world comes back byte for byte from the server alone.
Iterate the science outside Unreal
Cook and package cycles are slow. A light browser bench and headless runs answer physics questions in seconds; Unreal is for how it looks and plays.
Stream instead of baking maps
One packaged map per location gave nice screenshots and a dead end. Building terrain around the traveller on request scales to a planet.
Make it testable without a person
Offscreen runs with scripted movement and actions save stills that a reviewer, human or model, actually looks at.
Small messages, exact surfaces
Re-reading 33 MB per action made mining take 4 to 40 seconds; a few-kilobyte change record made it about one. A surface drawn 15 cm off the record made aim rays miss: equal, not close.
Budget the GPU like a shared lab instrument
One Unreal job at a time, memory caps, an explicit GPU choice, and A/B switches for frame time (a dense forest tripled it from 6.7 to 21.9 ms).
Why it matters: working with AI agents
Agentic coding runs overnight
Long engineering tasks went to headless coding agents that worked through the night. A lead agent reviewed each finished piece, ran the checks and merged only what passed; the human set goals and rules and reviewed results in the morning.
Simulation and science are within reach
Plate kinematics, energy-balance climate, river incision, crater scaling and exact mineral accounting from cited empirical relations used to need specialist teams. Recent frontier models read the literature, pick a defensible approximation, implement it and state what it does not cover.
Models are learning game engines
They write engine plugins and build scripts, drive offscreen captures, read the screenshots and spot seams, wrong materials and missed collisions. Not perfect, still directed by a person, but a real change in what a small team can attempt.
Speed needs rails
Unattended work drifts. One agent quietly limited blasting to a single region because its task was scoped to one window. After it was fixed, written rules, a decision ledger checked by a script and a merge gate that refuses unacknowledged risks were added; they caught the next drift within the hour.
Give decisions stable identifiers, explicit scope, dependencies and acceptance criteria. Keep the reasoning and evidence findable across handoffs. Changed decisions retain a visible history.
Rules travel with every task
Attach applicable constraints to each assignment and resume. Name the owned files, inputs, expected output and unresolved assumptions so the next person starts with the same boundaries.
Review before merging
Read the actual changes, exercise the intended behavior and inspect the evidence before integrating the result. Agreement alone is not acceptance.
Mechanical checks support judgment
Check broken references, missing evidence and common rule violations automatically. Text matching cannot prove physical validity or completeness. Review must still follow the causal chain.
What these maps can tell you
Recorded, not reconstructed.
Data come from the simulated planet run and its saved climate and material-history calculations. The native globe has 576 × 288 cells, spaced 0.625° apart: about 70 kilometres north–south. Present-day display textures are 8192 × 4096 pixels; historical textures are 4096 × 2048. Zoom does not add simulated detail.
Climate, rivers, rock types, rock ages, volcano records and mineral provinces describe the final snapshot. Only six fields have saved frame history. The chart reads 200 recorded samples. Older rock ages include declared pre-run material. A mineral province is geological context, not a measured ore reserve.
Province numbers are public display identifiers derived from the saved catalogue, not names or new geological assignments. The underlying location, interval and class remain those of the recorded data.
All maps and interactive assets are bundled locally. Three.js license.
Two denser views of the same planet for readers who want the machinery: how the plates move, and where melting builds crust and concentrates metals. Click a figure for full size.
Plates in motion
Twenty plates at 400 million model years. Arrows show each plate's velocity from its rotation pole, and labels give its speed in centimetres per year. Red edges are spreading ridges, blue are subduction trenches, green are transform faults. Motion is a prescribed plate model, not a solved mantle flow.
Where the planet melts, and what that leaves behind
Four views from the same saved records. Top left: relief, plate boundaries and active arc volcanoes. Top right: continental crust thickness, with the magmatic crust each volcano has built. Bottom left: hotspots, rifts and large igneous provinces coloured by time since their last eruption; hotspot chains age along the plate motion. Bottom right: where the recorded history favours porphyry copper, seafloor massive sulphides, pegmatites, nickel-copper-platinum and kimberlites. Plume and deep-mantle outlines were not recorded in this run.
Retained in-game views
Browse the world.
Walk beside banded cliffs, follow a coast, or look across a volcanic landscape. These dated game captures show earlier stages as well as newer terrain and destruction work. They are development views, not a claim that every feature is finished. Open a view to find its recorded position on the globe.
Older scenes may differ from the current atlas geography. Locations mark the recorded camera or chart origin, not an inferred landmark. Images are cropped to remove the debug display; the terrain itself is unchanged.